Isoxazoles, muscimol, ibotenic acid, muscarine, mannitol, trehalose, and why the whole mushroom is not a single pure compound.
chapter 1composition
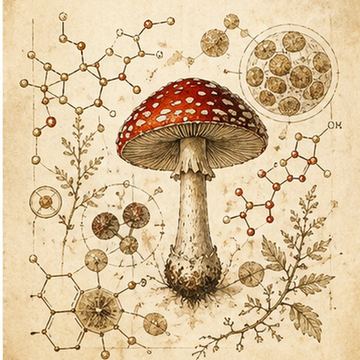
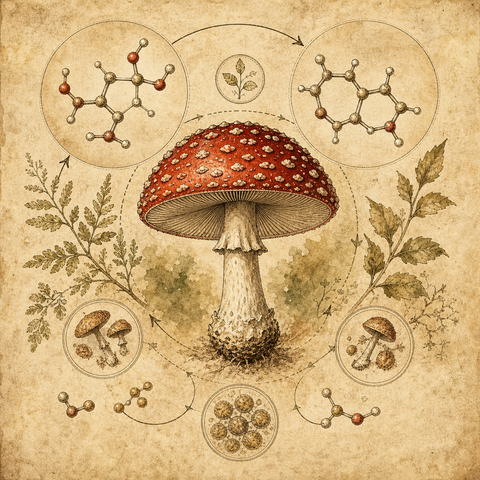
The whole mushroom is treated as a combination of active and supporting molecules, so pure muscimol is not equated with the mushroom.
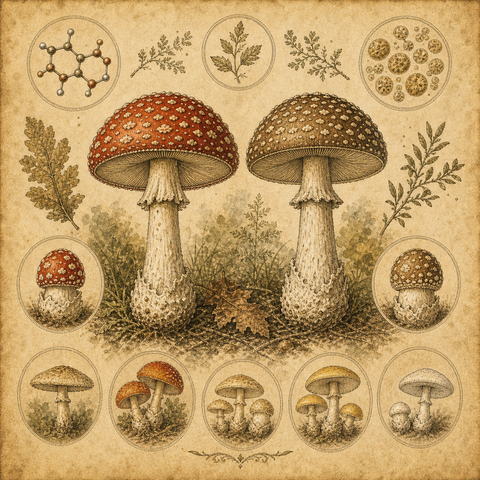
Ibotenic acid and muscimol are isoxazole compounds; ibotenic acid can decarboxylate into muscimol.
Drying, heat, acidity, storage, batch, and mushroom part change the practical profile.
Mannitol is described as a transporter molecule; trehalose and polysaccharides are important non-psychoactive components.
Whole mushroom, not one molecule
Red amanita cannot be reduced to pure muscimol. The effect is shaped by isoxazoles, weakly psychoactive and non-psychoactive components, preparation, and raw-material state.
Ibotenic acid and muscimol are the central isoxazoles.
Muscarine was historically overestimated but does not explain the main effects.
Preparation changes the profile as much as species name.
Isoxazoles and conversion
Ibotenic acid and muscimol are linked through decarboxylation. Temperature, acidity, processing time, drying, and storage influence the final profile.
High-ibotenic material is described as more raw and requiring processing awareness.
Muscimol is linked to the GABA-A system and a profile of relaxation, trust, and diffuse attention.
Isoxazoles can be lost during drying and storage, so standardization matters.
Beyond psychoactive compounds
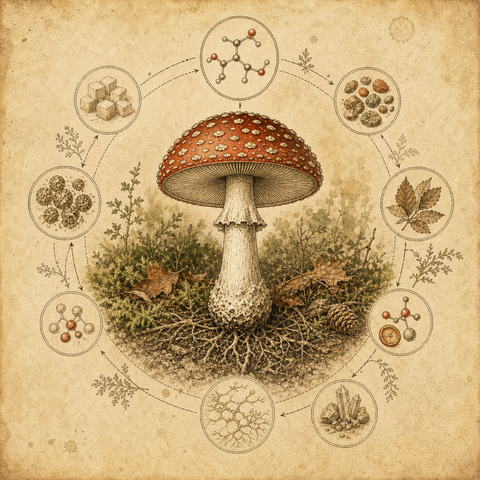
Mannitol, trehalose, polysaccharides, antioxidants, pigments, vitamins, and other molecules are highlighted. They do not make the mushroom automatically safe, but explain why it is treated as a whole system.
Mannitol is presented as a transport component.
Trehalose and polysaccharides belong to the non-psychoactive profile.
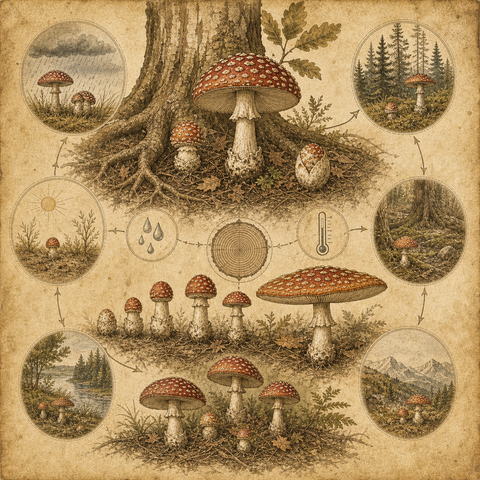
Batch, tree partner, region, season, and storage change the real strength.
Buyer takeaway
The practical idea is simple: the same gram from different batches may not work identically. Batch, format, storage, careful start, and no mixing with strong variables matter.
Ibotenic acid
An isoxazole linked to a more raw, stimulating profile; processing can convert it toward muscimol.
Muscimol
The key GABA-A-profile component: relaxation, sleep, trust, diffuse attention.
Mannitol
Highlighted as a transport component.
Whole profile
The mushroom is not pure muscimol; small and non-psychoactive components matter.
Entry reactions, excessive dosing, contraindications, incompatible states, and caution with medication or psychoactive substances.
chapter 9stop signals
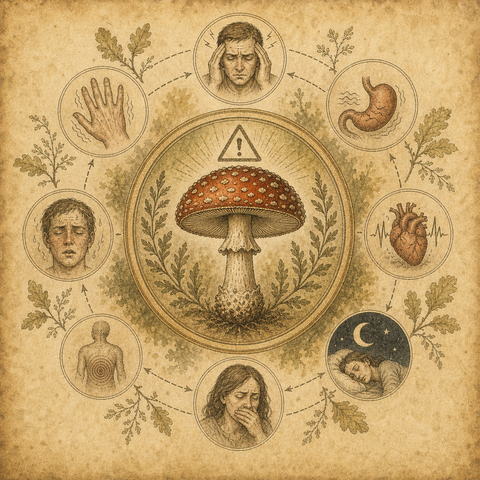
Entry reactions may include dizziness, nausea, digestive reactions, sleepiness, tremor, poorer coordination, salivation, and unusual body sensations.
Marked euphoria, intoxication, altered perception, obsessive thoughts, or reduced self-control are signals to reduce or pause.
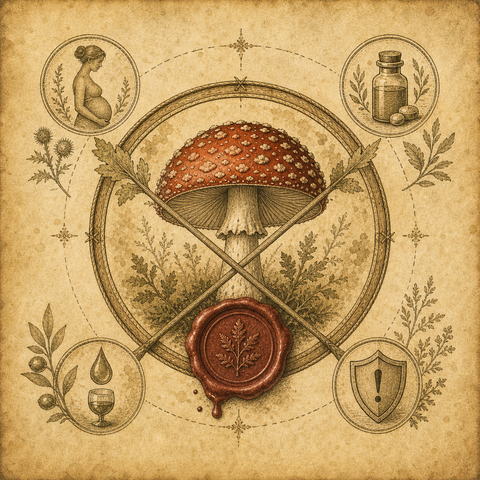
Direct limits include individual intolerance, strong mushroom allergy, muscimol hypersensitivity, pregnancy, lactation, and childhood.
Special caution is described with severe psychiatric conditions, schizophrenia predisposition, antidepressants, antipsychotics, mood stabilizers, stimulants, and other psychoactive substances.
Entry reactions
Entry reactions are described as the nervous system responding to a new state under isoxazoles. They can appear through the body, emotions, and coordination.
Nausea, dizziness, sleepiness, diarrhea, tremor, salivation, and organ sensations are possible.
More common in unprepared beginners, excessive amounts, weak goal setting, or fear of amanita.
Food may smooth absorption, but strong reactions should not be ignored.
Leaving the working zone
If the amount is too high, microdosing can move toward a medium-dose zone: judgment, behavior, mood, and perception of time or space may change.
Driving, negotiations, and responsibility-heavy situations are unwanted.
With intoxication, euphoria, or strong negativity, reduce or pause.
Effect intensity is not a quality marker.
Contraindications
This section lists individual intolerance, strong allergy, muscimol hypersensitivity, pregnancy, lactation, and age under 18 as limits.
Severe psychiatric conditions and family schizophrenia risk require special caution.
Psychotropic medication needs a medical frame.
Alcohol, stimulants, and other psychoactive substances can be unpredictable.
When to stop
Strong or prolonged reactions, psychiatric worsening, allergic signs, sleep disruption, loss of control, or urge to intensify move the situation out of a simple guide and into medical territory.
Entry
Nausea, sleepiness, digestion, tremor, and other reactions may be nervous-system adaptation signals.
Excess
Intoxication, euphoria, or poor judgment means leaving the microdosing zone.
Avoid
Pregnancy, lactation, childhood, strong allergy, hypersensitivity, and severe psychiatric risks.
Do not mix
Alcohol, stimulants, psychoactive substances, and abrupt medication withdrawal are unpredictable.
Goal setting, a calm first day, minimal start, day-long observation, baseline selection, and pauses between courses.
chapters 6-7course
A concrete goal is set first: sleep, anxiety, dependence, emotional reactivity, pain, focus, or another defined area.
The start is minimal and observations are made through the day; if a clear effect appears, the previous level is treated as a more suitable baseline.
Microdosing should not create visuals, intoxication, or loss of control; such effects are described as excess intensity.
Breaks between courses are used not only for rest but also to consolidate changes.
Task first
Microdosing begins with a goal. A large request is broken into smaller tasks because a concrete formulation helps keep control.
Choose one clear task, not everything at once.
The goal should be checkable in a journal.
Discipline is as important as the format for psychological tasks.
First day
The first use is framed as a calm day in a comfortable place, without driving, negotiations, dates, parties, or fast-response situations.
Morning is described as convenient for starting.
Record sleep, pressure, state, and medication before starting.
Observe during the day without increasing immediately.
Finding tolerability
This section describes gradual movement from a minimal amount toward the first noticeable effect. The calmer previous level becomes the working reference.
Strong sensations mean the working zone has been passed.
Sensitive people may need nervous-system adaptation time.
Do not change format, timing, food, and other variables all at once.
Course and pause
A course should not become a chase for new effects. Pauses are for consolidating results, not only for resting from the mushroom.
A journal shows what actually changed.
A pause shows whether the result holds.
Wanting to repeat more often is a reason to review the goal.
Goal
One concrete task instead of trying to get every possible effect at once.
First day
A calm setting, no driving, negotiations, or high-responsibility events.
Journal
Record sleep, anxiety, body state, food, stress, medication, and reaction.
Pause
Used to consolidate results and see what remains without intake.
Why microdosing should not feel like intoxication, what is tracked in sleep, anxiety, and body state, and when a reaction is too much.
chapters 6-9tracking
Tracked areas include sleep, anxiety, mood, energy, pain, body tension, stress response, and craving patterns.
Unwanted reactions include heavy sleepiness, nausea, diarrhea, panic, irritability, worse sleep, stronger anxiety, or poor coordination.
A highlighting effect may appear, where old somatic or psychological symptoms can temporarily become more visible.
Reports and request statistics are observation material, not a guaranteed result for every person.
Expectations
This section states that amanita microdosing normally should not create intoxication, visuals, or loss of ordinary perception. It is a working tool, not entertainment.
“Not interesting” is usually a wrong expectation.
First changes may not be immediate.
Others may notice changes before the person does.
What is tracked
Observation focuses on sleep, anxiety, emotional tone, energy, pain, body tension, craving patterns, and stress response.
Compare state before and after the course.
Tests and journal reduce memory bias.
Feedback from close people can be part of assessment.
Flare-up and highlighting
Old or hidden somatic and psychological issues may temporarily become more visible. This is not a treatment promise; it is a signal to observe carefully.
Headache, digestion, joints, skin, and anxiety themes can appear.
Strong flare-ups need pausing or medical assessment.
Not every discomfort is a useful process.
Unwanted side
Anxiety, irritability, long diarrhea, heavy sleepiness, worse sleep, panic, poor coordination, or urge to intensify should not be romanticized.
No hit
Normally microdosing should not create strong intoxication or perception shifts.
Track
Sleep, anxiety, energy, pain, dependence cravings, and emotional stability.
Highlighting
Old symptoms may temporarily become more visible.
Stop
Panic, heavy sleepiness, poor coordination, or worse sleep are warning signs.
The journal as a personal lab record, task setting, discipline, result consolidation, and caution with medication.
chapters 6-7journal
Before starting, record sleep, pressure when relevant, mood, anxiety, medication, food, workload, and current complaints.
A journal turns the course into a lab record and helps connect format, timing, food, stress, and reaction.
Additional tools in this guide include walks, physical activity, breathing practices, meditation, calm music, and psychological support.
With antidepressants, antipsychotics, mood stabilizers, or tranquilizers, medical supervision and no abrupt withdrawal are emphasized.
Journal as a lab
The journal is described as a way to turn microdosing into observable experience. It records state, conditions, sensations, and side effects.
Record sleep, mood, anxiety, body, food, stress, medication, time, and format.
The journal reveals links between reaction and context.
Writing by hand is treated as part of psychological work.
Body support
During the course, walks, movement, nutrient support, vitamins, and minerals matter because neuroplastic processes require resources.
Intense training increases support needs.
Sleep and food remain part of the process.
Amanita should not replace basic body care.
Psychological frame
Meditation, breathing, contemplation, relaxing music, a psychologist, or experienced friends are described as possible supports when they make the process calmer.
The point is stable conditions for observation.
Support matters especially for psychological goals.
Pressuring another person into microdosing is not supported.
Medication and diagnoses
This section warns that abrupt withdrawal of antidepressants, antipsychotics, mood stabilizers, or tranquilizers and switching to microdosing is dangerous.
Baseline
Record state before starting: sleep, pressure, mood, medication.
Resources
Sleep, food, walks, movement, vitamins, and minerals support the process.
Support
A psychologist, calm practices, and experienced friends can help the frame.
Medication
Abruptly stopping psychotropic medication and switching to amanita is not advised.
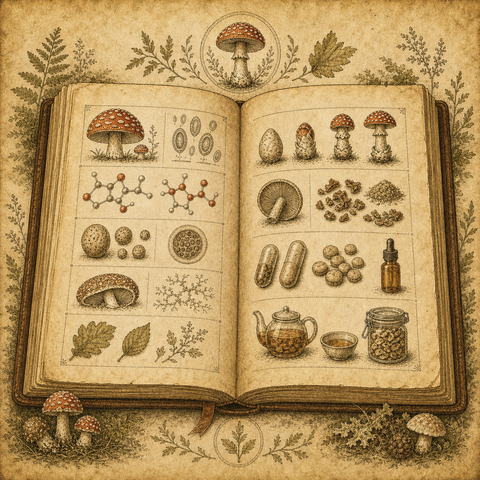
Dried caps, powder, capsules, infusions, and decoctions: how format changes speed, predictability, and raw-material control.
chapter 5comparison
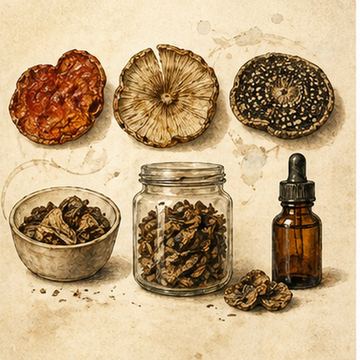
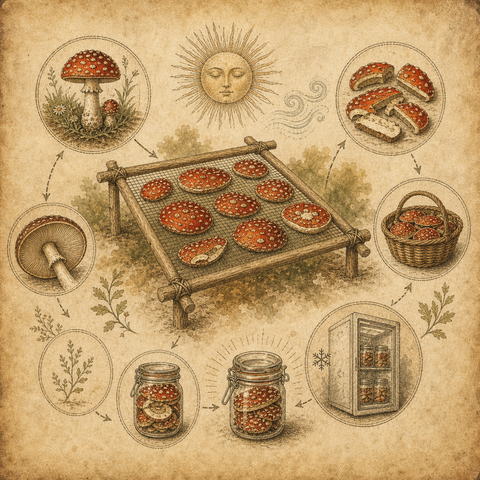
Dried caps allow visual inspection and preserve activity longer with correct storage.
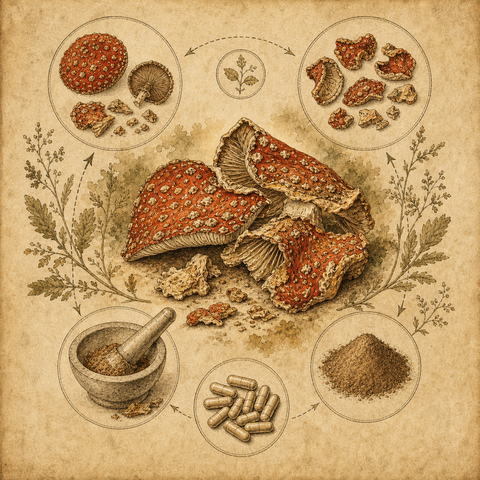
Powder averages a batch and is convenient for capsules, but loses isoxazoles faster because of larger surface area.
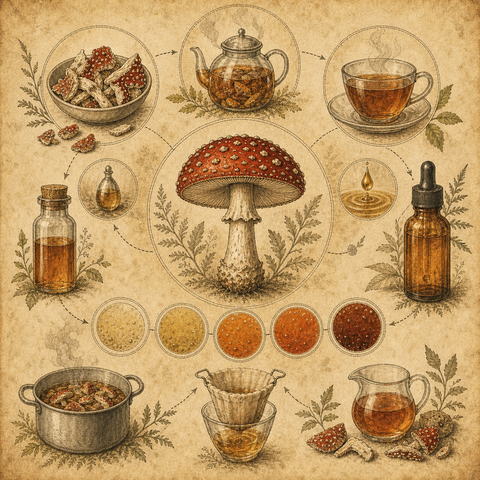
Decoctions and infusions act faster because active compounds are already in liquid, but concentration is less obvious without control.
Fresh and frozen caps are described as higher-ibotenic material that requires separate processing awareness.
Dried caps
Dried caps are called the classic and pragmatic method because they are easier to link to batch, storage, and stability.
The original raw material is visible.
Whole caps store activity better than powder.
New manipulations require new concentration awareness.
Powder and capsules
Powder averages a batch and is convenient for capsules, but hides the appearance of the caps and stores worse.
Capsules help routine but are not automatically pharmaceutical.
Powder is better made closer to use.
Batch labeling remains important.
Liquid forms
Infusions and decoctions act faster because active compounds are already in the liquid, but concentration depends on material, grinding, heat, time, and acidity.
Fresh and frozen caps differ from aged dried caps.
Acidification is linked to ibotenic-to-muscimol conversion.
Without control, liquids are less predictable.
Do not mix without a goal
Format is chosen for task and tolerability. If species, timing, food, and preparation are changed together, the journal stops showing what worked.
Caps
Classic and more controllable when batch and storage are clear.
Powder
Convenient, but loses isoxazoles faster and hides the raw material.
Capsules
Help routine, but do not make raw material automatically identical.
Decoctions
Act faster, but require a new understanding of concentration.
Panther amanita is described as stronger and less studied: higher isoxazoles, a different energetic profile, and separate caution.
chapter 6species
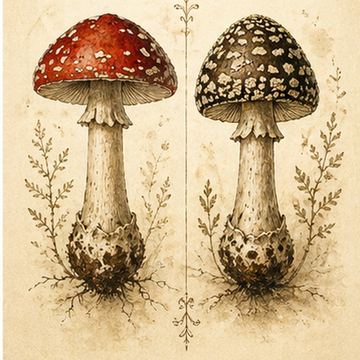
Red amanita is the main, better-studied, more familiar baseline.
Panther amanita is described as 3-5 times stronger and less forgiving of mistakes.
The older idea about tropane alkaloids in panther amanita is unsupported by modern analysis.
Casually combining red and panther amanita is not recommended; one working tool should be chosen.
What is known about panther
Panther amanita is described as less studied. It is said to contain more isoxazoles, less muscarine, and additional energetic and transport components.
Higher ibotenic acid and muscimol.
Stizolobic and stizolobinic acids.
Mannitol, trehalose, antioxidants, anti-inflammatory activity, and APL lectin.
Why it is stronger
Its strength is explained not by tropane alkaloids, but by higher isoxazole concentration and probably other not fully studied components.
The scopolamine/hyoscyamine idea is outdated.
Pantheric acids still have unclear role.
Panther biochemistry needs more modern studies.
Practical takeaway
Red amanita is presented as a calmer baseline; panther is a stronger, more “masculine” tool that needs more control.
Do not choose panther out of curiosity.
Combining red and panther is not recommended.
Individual reaction must be watched more strictly.
No promises
Species difference helps explain formats, but it should not become a result promise or a push toward experiments without a goal.
Red
Better studied baseline with a calmer working profile.
Panther
Described as stronger, more energetic, and less forgiving of mistakes.
Biochemistry
Higher isoxazoles, lower muscarine, additional acids and transporters.
Choice
Do not combine both species without a clear reason; choose one tool.
The core isoxazole pair: how raw profile, processing, drying, and final feel are connected.
chapter 1isoxazoles
The pair cannot be separated from raw quality, processing, and storage.
Drying, heat, acidity, and time can shift their balance.
The same weight from different batches may not feel identical.
Why it matters
A buyer does not need laboratory chemistry, but they should understand that amanita is not one perfectly even standardized compound. Species, batch, drying, and storage all matter.
A raw profile may feel different from a well processed one.
Batch stability matters more than a pretty product description.
Processing and profile
Processing is part of the practical profile, not a cosmetic step. Format, temperature, moisture, and storage are not minor details.
Why amanita is treated as a complex profile, not only as one active component.
chapter 1profile
The whole mushroom is more complex than pure muscimol.
Supporting components affect how raw material is perceived.
Different batches may have different accents even in the same format.
Not one molecule
Red amanita is a biochemical complex, so it helps to understand both active isoxazoles and background components that shape the raw material.
Mannitol and trehalose belong to the important non-psychoactive part.
Pigments and antioxidants describe the profile, not a medical promise.
Practical meaning
When choosing a product, the customer should understand that format, batch, and storage affect experience. This reduces the expectation of identical results from every item.
Products are not compared by grams only.
Formats are not mixed without a reason.
Pure compound
Simpler to describe, but not equal to the whole mushroom.
Whole profile
Includes active and background components.
Buyer
Batch, format, and storage matter.
Key terms
Composition, muscimol, and ibotenic acid make the product easier to understand.
Season, location, host tree, cap maturity, drying, and storage change practical raw-material strength.
chapters 3-4quality
Region, season, and fruiting-body state matter.
Different parts of the mushroom may vary in concentration.
Batch and storage matter more than casual “stronger/weaker” language.
Batch factors
Raw material is shaped by habitat, host tree, maturity, moisture, and time between collection and drying. A quality shop explains format without promising identical strength for everyone.
Young and mature caps may differ.
Poor drying creates mold and profile-loss risks.
How to explain it
The guide should tell the buyer honestly: a good choice begins not with maximum strength, but with clear origin, storage, and cautious first contact with a batch.
Differences in raw control, convenience, aging speed, and predictability.
chapter 5comparison
Caps keep raw-material control clearer.
Powder averages the batch but contacts air faster.
Capsules support routine but do not solve raw-quality questions.
When caps matter
Caps suit people who want to see the original material and work carefully with a batch. This does not make the format “stronger”, but it makes it more understandable.
Raw material can be visually assessed.
Dryness and storage are easier to understand.
When capsules help
Capsules are practical for routine, especially when the batch is already clear. But a capsule does not guarantee sameness: it still contains one specific batch.
Convenience is higher.
Origin control is lower if the batch is not described.
What indicates leaving the working zone: intoxication, panic, heavy sleepiness, digestion, and coordination.
chapter 9stop
Intoxication and poor judgment are not microdosing.
Panic, heavy sleepiness, and poor coordination call for stopping.
Strong digestive reactions should not be ignored.
Entry reactions
Sleepiness, bodily unfamiliarity, digestion, anxiety, or old symptoms becoming more visible can occur. They should not be romanticized; they need observation and caution.
Record them in the journal.
Do not intensify while uncomfortable.
Stop signals
Loss of control, strong anxiety, intoxication, poor coordination, marked nausea, or worsening mental state should clearly stop the process and lead to professional help when needed.
Pregnancy, lactation, age, allergy, psychiatric risks, medication, and other caution factors.
chapter 9limits
Not for children, pregnancy, or lactation.
Caution with severe psychiatric states and family predisposition.
Prescribed medication must not be stopped abruptly.
Where not to experiment
There are situations where self-experimentation is inappropriate: under 18, pregnancy, lactation, strong allergy, hypersensitivity, and severe psychiatric risks.
This is not a format-selection issue.
Professional consultation is needed.
Medication and substances
Special caution is needed with psychotropic medication, stimulants, alcohol, and other psychoactive substances. The guide should clearly state that abrupt medication withdrawal is not acceptable.
Why the guide separates species and does not treat them as interchangeable.
appendicesspecies
Red amanita is this sectionline and better studied point.
Panther is described as stronger and less forgiving of mistakes.
Unknown species are not for buyer experiments.
Do not interchange
Even if species are isoxazole-bearing, they are not identical. The site should not merge red and panther explanations into one generic card.
Different strength profile.
Different study level.
For the buyer
The section should support cautious choice: if someone does not understand the difference, they should not begin with the stronger and less studied option.
Short explanations: microdosing, isoxazoles, decarboxylation, batch, format, and stop signals.
navigationterms
Terms stay short and clear.
Each term is tied to practical meaning.
The glossary makes product cards and articles easier to read.
Key words
Microdosing is low-intensity observation. Isoxazoles are the main active group. Decarboxylation is a profile change during processing. Batch means one specific collected and processed raw-material volume.
Format means how the raw material is delivered.
Stop signals are signs to discontinue the process.
Why it belongs here
The glossary lowers beginner anxiety and makes the guide clearer: terms are gathered in one place and tied to practical meaning.
From Telegram polls to published stories: what was collected and where conclusions stop.
methodologysource reading
Questions were added as the project developed.
Polls and stories provide different kinds of information.
Editorial emphasis does not strengthen the evidence.
Where the data came from
Public polling and report collection on Telegram began in August 2019. The questionnaire reached 107 questions, added over time, so response counts differed between questions.
Not everyone answered every question.
This is not one group with complete responses.
What the method can show
The author explicitly states that the project was not a double-blind, placebo-controlled clinical trial. Its numbers describe participant responses, with limited scope for generalization.
A reported change does not explain its cause.
Testing hypotheses requires other research methods.
How the stories were edited
Reports were translated from Russian, punctuation was edited for clarity, and words describing positive effects were highlighted. These are presentation choices, not independent verification of the stories.
Translation and editing shape the account.
Highlighted words do not replace reading the full report.
Reading critically
Distinguish an answer to a question, an individual story, and an author interpretation. Check the page, data type, and limitations behind a statement before turning an observation into an expected result.
A poll describes how respondents chose answers.
A story can suggest a question, not confirm a treatment.
Poll
Responses to a particular question.
Story
Individual experience as described by a participant.
What a response share means, why the denominator matters, and which comparisons can mislead.
statisticsresponse counts
Start with the question and response count.
Then read the count and share for each answer.
Different tables may describe different respondent groups.
Start with the denominator
The denominator is the response total behind a percentage. The general-information pages use 1642 responses for age, 983 for gender, and 604 for species used. These are different calculation bases, not efficacy measures.
Project participation is not the response count for every question.
Find the denominator separately for each table.
Counts and shares
A percentage is the count choosing an answer divided by all responses to that question, multiplied by 100. The same percentage can represent very different numbers of responses.
Read the percentage alongside the absolute count.
Rounding can slightly change the displayed total of shares.
Why tables differ
Questions were added gradually, and respondents did not answer an identical set. Do not add counts across tables as if they represented separate people, or assume every table describes one fixed sample.
Compare question wording and answer options.
A missing answer does not mean no change occurred.
What percentages cannot show
The poll reflects reports from people who chose to participate and answer. It does not estimate the same experience for everyone or isolate expectations and other circumstances.
A descriptive share is not a clinical prediction.
A large response count alone does not remove methodological limits.
Positive, mixed, and unwanted experiences, alongside reports of no change.
reportsinterpretation limits
A positive report describes the narrator's experience.
Mixed and negative accounts matter too.
Published story counts do not establish outcome frequency.
Positive accounts
Some participants describe calmer moods, good sleep, and easier waking. These are subjective assessments: they show how someone perceived a change, not what caused it.
An account of experience is not a promise to the reader.
A vivid story does not determine the strength of evidence.
Mixed results and no change
Other stories describe no noticeable change, a mixture of pleasant and unpleasant experiences, or a return to the previous state. An early positive impression does not establish a lasting result.
One report can contain different assessments.
A return to the previous state matters to the whole story.
Unwanted and opposite experiences
The book includes reports of insomnia and daytime sleepiness. In a discussion of smoking, participants describe opposite changes: some report more cigarettes, while others report fewer.
Contradictory stories cannot be combined into one general effect.
These examples do not estimate the chance of unwanted experiences.
Assessing the stories
Reports were translated and edited, with positive words highlighted. Feeling better and unchanged test results can coexist in an account. These are different observations, not confirmation of a clinical change.
A collection of stories supplies no denominator for frequency estimates.
Read the whole account, including the absence of changes.
Positive
The participant describes a pleasant change.
Mixed
Assessments differ or change over time.
No change
The participant does not notice the expected shift.
Unwanted
The participant describes an unpleasant experience.
What Hericium erinaceus identifies, and what the familiar name leaves unspecified.
lion's maneidentity
Species, fungal part and product form are separate details.
A photograph cannot establish the composition of a batch.
From name to organism
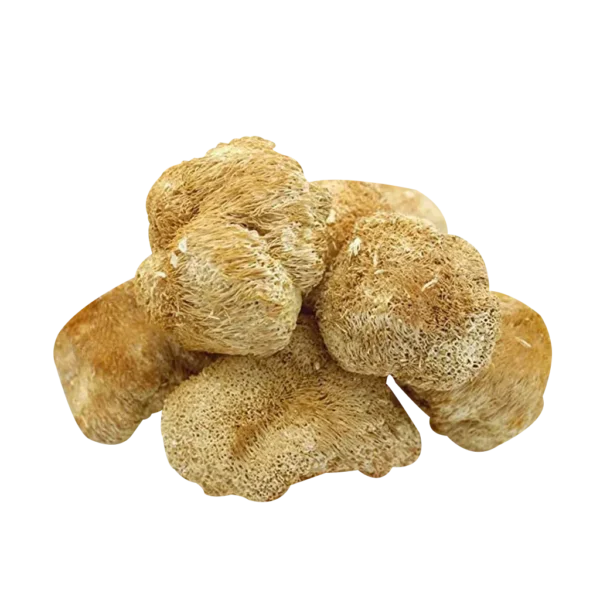
Kew describes white fruiting bodies with hanging spines, growing on wood. This describes the organism, not a way to authenticate powder by appearance. A scientific name helps match a label with a publication when common names differ between languages.
Match both words of the scientific name, not just Hericium.
One species, different materials
Fruiting body and mycelium name different fungal structures. Corana and colleagues compared their chemical profiles in sampled material. Such measurements describe those samples; they neither establish the composition of every similarly named product nor demonstrate a benefit in humans.
A compound name alone does not state its amount in your batch.
Connecting a product with a source
Record the species, declared part, material form and batch identifier before comparing documents. Then check which sample a laboratory report describes. A study link without a material description cannot show how closely a packaged product resembles the research material.
Check agreement between the label, ingredient description and batch document.
Cordyceps militaris and Ophiocordyceps sinensis are not interchangeable identities.
cordycepsnames
Cordyceps militaris and Ophiocordyceps sinensis are different species.
A general name leaves the fungal part and product composition unspecified.
Why names differ
Sung and colleagues revised classification using multiple genes. The older name Cordyceps sinensis corresponds to Ophiocordyceps sinensis, not Cordyceps militaris. When reading older papers, connect previous and revised names without collapsing different species into one identity.
A shared word in two names does not establish the same organism.
Species is not the whole ingredient
Next check whether the material is described as mycelium, fruiting body or a mixture, and whether its product form is specified. These are separate questions. A general name cannot supply missing details, and a photograph cannot authenticate packaged powder.
A useful description connects species, fungal part and batch identifier.
Keep research attached to its material
The human study by Hirsch and colleagues examined a mushroom blend containing C. militaris. That reference is not a separate test of every cordyceps product. The distinction between a blend and a single ingredient matters regardless of the article headline.
Check the studied composition before interpreting the research design or findings.
Fungal structures and growing media describe different aspects of a material.
fungal partscomposition
Mycelium is not a plant root.
Growing medium and harvested fungal material are not synonymous.
What does the label identify?
Separate the organism from its declared part. FDA guidance distinguishes mycelium for US food labeling. Here that document illustrates precise material descriptions; it does not state Israeli labeling requirements. Naming the part helps establish which materials are comparable.
The phrase mushroom product does not specify a particular fungal part.
Composition cannot be guessed
Doar and colleagues measured erinacines across Hericium erinaceus tissues and growing conditions. Differences belong to that laboratory comparison. They do not establish that one part is always better, or transfer a lion's mane profile to cordyceps and every commercial batch.
This was chemical research, not a test of outcomes in humans.
Useful questions about the material
When grain cultivation is mentioned, ask separately whether grain material remains in the final ingredient. Mycelium alone does not answer that question. Likewise, fruiting body does not replace batch information. The aim is a clear description, not a winner based on terminology.
Keep unknown details separate from the explicitly declared composition.
Form, material ratio and measured content answer different questions.
labelsterminology
Dry does not rule out an extract.
A material-to-extract ratio is not a measurement of clinical effect.
Form and origin
EMA terminology distinguishes starting material from preparations derived from it. The guideline concerns EU herbal medicines and includes fungi in its definitions. Here it explains terms, not whether any particular product is a registered medicine or meets local rules.
Read species, fungal part and form as separate characteristics.
What a ratio describes
DER relates starting material to the resulting preparation. Ask whether it describes an extract without excipients or a finished ingredient. The ratio alone cannot specify every compound, establish that two compositions match, or rank products by an expected outcome.
Check carriers and other added components in the composition description.
A percentage needs a named measurement
Total polysaccharides and beta-glucan are not identical analytical measures. McCleary and Draga studied glucan measurement, including differences between methods. Comparing percentages requires the same defined measurement, units and reporting basis. Without those details, an apparently precise number remains incomplete.
Measured content cannot replace separate evidence about outcomes in humans.
Sample, method, result and detection limit matter more than a tested badge.
batchlaboratory
First connect the document to a particular sample.
Then distinguish a measured result from its assessment criterion.
Which material was tested?
Match the product name, batch identifier, sample description, laboratory and document date. Testing a starting ingredient does not automatically test a finished mixture. A mismatch needs explanation; a logo or tested badge cannot supply the missing connection to a package.
One document does not characterize every future shipment of a product.
What was measured?
FDA guidance for US manufacturers distinguishes methods, limits and actual results. This is a useful reading framework, not confirmation of Israeli compliance. For each entry, look for the measurement, unit and comparison criterion. A pass alone can omit useful detail.
Testing one measurement does not imply screening for every possible contaminant.
Not detected is not necessarily zero
NIST distinguishes signal detection from quantitative determination. Read ND, LOD and LOQ alongside the laboratory explanation. An undetected signal does not establish absolute absence. Interpretation depends on what was sought, the method and its sensitivity, not a universal promise.
An unlisted measurement remains unverified within the supplied document.
Study type, tested material and limits matter more than an appealing headline.
researchevidence limits
Identify the study type and tested material first.
Then check who participated and what was measured.
Cells, animals and humans
Experiments in cells examine processes in a selected system. Animal research examines another biological model. Neither automatically establishes human outcomes. NCCIH highlights this distinction when reading health news. Chemical analysis of composition is also not a clinical test of a finished product.
A mechanism, measured substance and human outcome are different things.
Two examples of human research
The pilot study by Docherty and colleagues examined Hericium erinaceus in 41 healthy adults. Hirsch and colleagues studied a mushroom blend containing C. militaris in 28 participants. These illustrate different materials and groups, not a verdict on all products.
A blend is not a single ingredient; small samples limit generalization.
From paper to a careful conclusion
Check controls, duration, selected outcomes, uncertainty and reported limitations. Read funding and material descriptions. Headlines cannot replace methods, and statistical differences are not automatically meaningful practical outcomes. These references illustrate research design without asserting efficacy or recommending product use.
A finding does not automatically transfer to another species, composition or population.
A percentage describes answers to a specific question, not the likelihood of a result for the reader. Anecdotes and descriptive polls do not establish causation or clinical efficacy.
Start with the question and response count.
Then read the count and share for each answer.
Different tables may describe different respondent groups.
Start with the denominator
The denominator is the response total behind a percentage. The general-information pages use 1642 responses for age, 983 for gender, and 604 for species used. These are different calculation bases, not efficacy measures.
Project participation is not the response count for every question.
Find the denominator separately for each table.
Counts and shares
A percentage is the count choosing an answer divided by all responses to that question, multiplied by 100. The same percentage can represent very different numbers of responses.
Read the percentage alongside the absolute count.
Rounding can slightly change the displayed total of shares.
Why tables differ
Questions were added gradually, and respondents did not answer an identical set. Do not add counts across tables as if they represented separate people, or assume every table describes one fixed sample.
Compare question wording and answer options.
A missing answer does not mean no change occurred.
What percentages cannot show
The poll reflects reports from people who chose to participate and answer. It does not estimate the same experience for everyone or isolate expectations and other circumstances.
A descriptive share is not a clinical prediction.
A large response count alone does not remove methodological limits.
 composition
Biochemistry and composition
composition
Biochemistry and composition








 Russian
  English
  Hebrew